

数据挖掘竞赛-一起挖掘幸福感EDA
发布于2019-08-07 13:33 阅读(1447) 评论(0) 点赞(4) 收藏(4)
 版权声明:署名,允许他人基于本文进行创作,且必须基于与原先许可协议相同的许可协议分发本文 (Creative Commons)
一起挖掘幸福感
- 简介
- 天池上的一个新人赛,属于比较简单的回归赛(由于target只有5个值也有人理解为分类赛,但是注意平台评分使用的是MSE,分类会使得分不合适),适合作为EDA的教程。
- 本文内容将主要倾向于数据探索部分(EDA),建模预测部分不多提。
- 建模思路为对高维特征降维后利用xgboost进行预测。
- 处理过程
- 数据获取
- 数据有官方提供,可以下载到自己的环境中也可以使用天池实验室进行数据集读取(我也将数据上传到Drive云盘)。
- 文件说明
- happiness_index.xlsx 调查结果表中各个字段及其不同值的含义说明。
- happiness_submit.csv 平台提交结果示例文件,利用pandas读取修改结果后提交到平台即可。
- happiness_survey_cgss2015.pdf 居民调查问卷的PDF文件(对比赛没有用处)。
- happiness_test_abbr.csv 简化版的测试集文件,包含除了target之外的所有特征中的一部分,特征较少,便于新手建模。
- happiness_test_complete.csv 完整版的测试集文件,包含除了target之外的所有特征中的全部,特征较多,适合有经验的玩家。
- happiness_train_abbr.csv 简化版的训练集文件,包括target以及所有特征中的一部分,特征较少,便于新手建模。
- happiness_train_complete.csv 完整版的训练集文件,包括target以及所有特征中的全部,特征较多,适合有经验的玩家。
- 数据探索(初步)
- 数据量
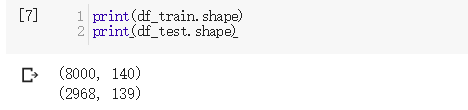
- 原始数据中,共8000个训练数据,2968个测试数据,除target外有139个特征。
- 目标分布
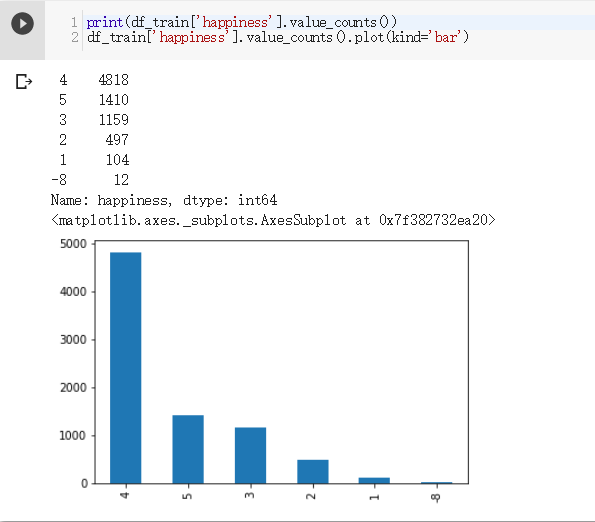
- 有12个异常值为-8,可以删除,为了保证数据完整,将其替换为3(不是幸福也不是不幸福)。
- 数据类型
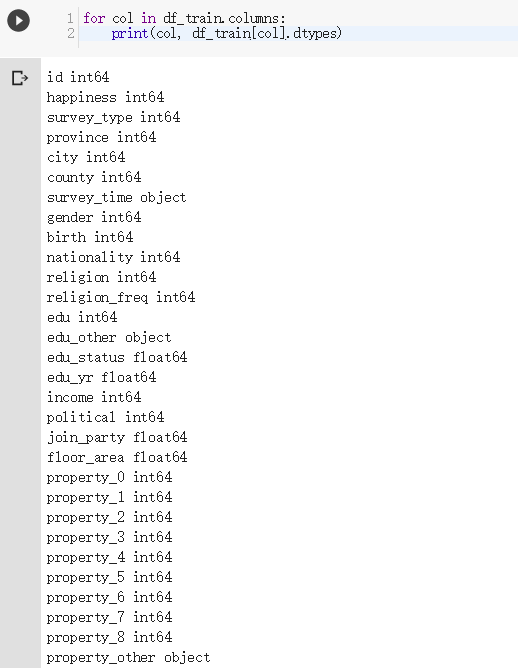
- 大部分为整型数据,少部分为object,需要解析为数值(通过逐列输出,survey_time应为时间类型,调整读取代码如下。)。
-
df_train = pd.read_csv('happiness_train_complete.csv', encoding='gbk', parse_dates=['survey_time']) df_test = pd.read_csv('happiness_test_complete.csv', encoding='gbk', parse_dates=['survey_time'])- 1
- 2
-
- 统计值
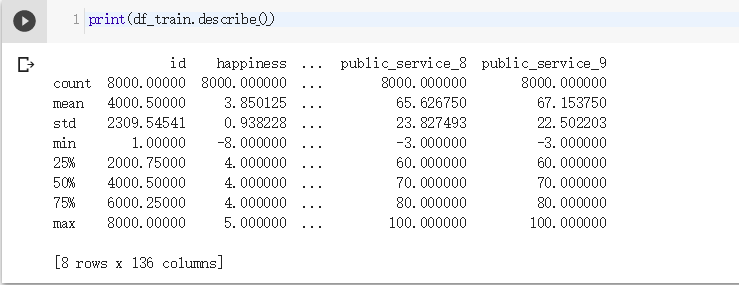
- 包括每一列的数据量、均值、标准差。最值。分位数等。
- 相关性
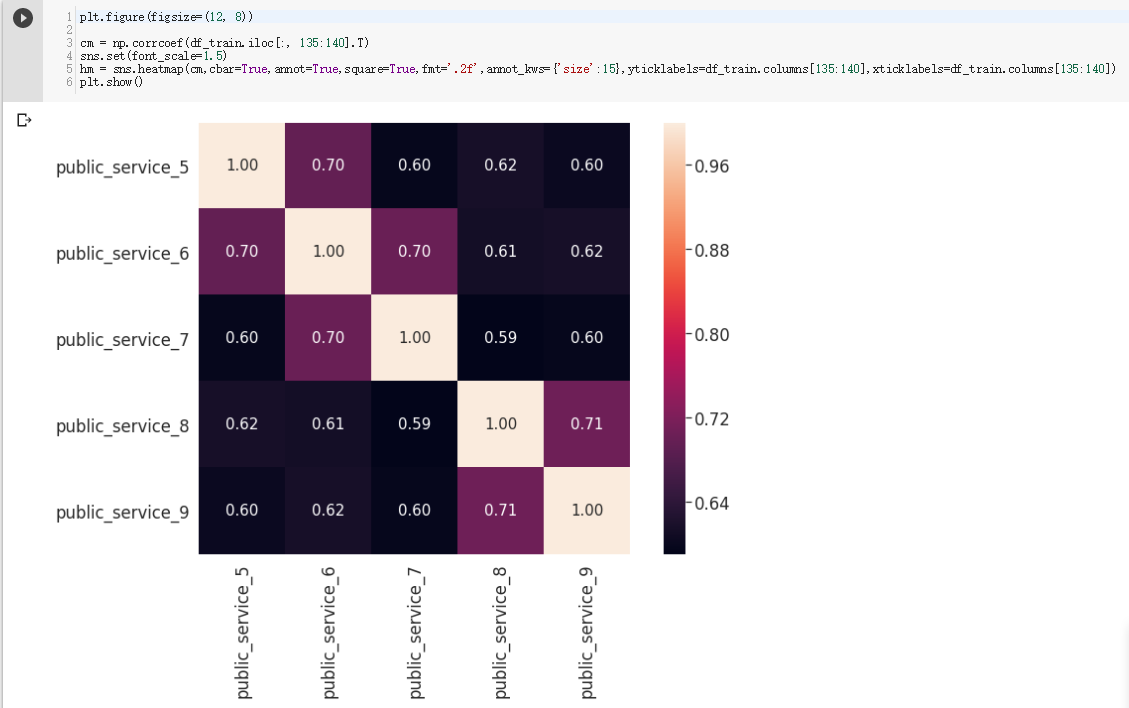
- 绘制相关矩阵图,建模是高相关特征必须只取一个(图中各项设计不错,无高相关)。
- 数据量
- 数据预处理
- 异常值处理
- 目标替换
- 将-8统一换为3。
df_train['happiness'] = df_train['happiness'].replace(-8, 3)
- 目标替换
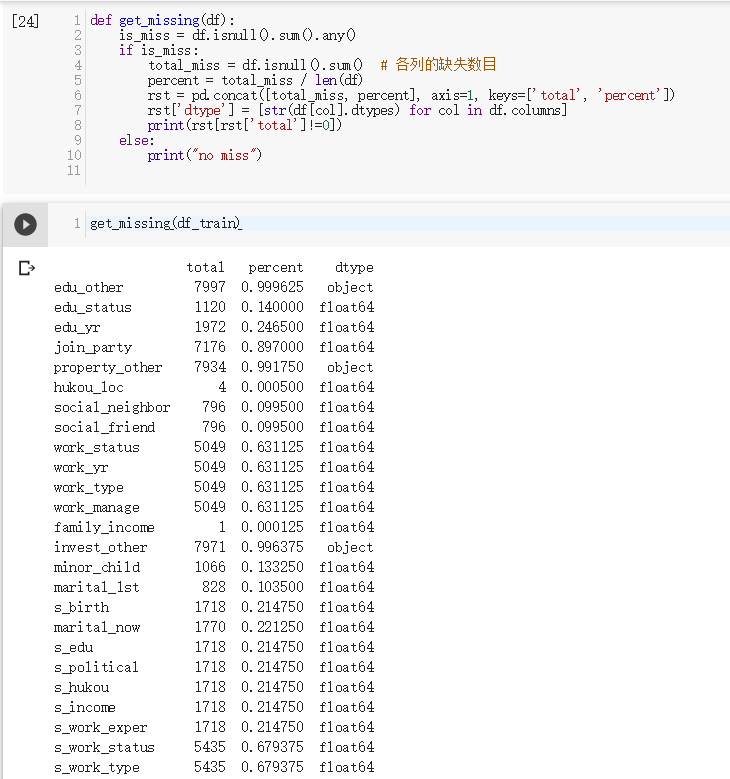
- 缺失值处理
- 检查缺失值
- 处理缺失值
- 依据index说明文件,hukou_loc的缺失使用4(表示待定)填充合理,其他如收入family_income使用均值填充。
-
def fill_data(df): df['hukou_loc'] = df['hukou_loc'].fillna(4) df['family_income'] = df['family_income'].fillna(df['family_income'].mean()) df.fillna(0, inplace=True) # 其余使用0填充- 1
- 2
- 3
- 4
- 检查缺失值
- 属性构造
- 构造年龄
-
def generator_attribute(df): df['survey_time'] = df['survey_time'].dt.year df['age'] = df['survey_time'] - df['birth'] generator_attribute(df_train) generator_attribute(df_test)- 1
- 2
- 3
- 4
- 5
-
- 构造年龄
- 异常值处理
- 探索性数据分析(EDA,基于处理后的较为完美的数据)
- 整体幸福状况
-
plt.figure(figsize=(16, 8)) plt.subplot(1, 2, 1) df_train['happiness'].value_counts().plot(kind='pie', autopct='%1.1f%%') plt.subplot(1, 2, 2) df_train['happiness'].value_counts().plot(kind='bar') plt.savefig('happiness_distribution.png')- 1
- 2
- 3
- 4
- 5
- 6
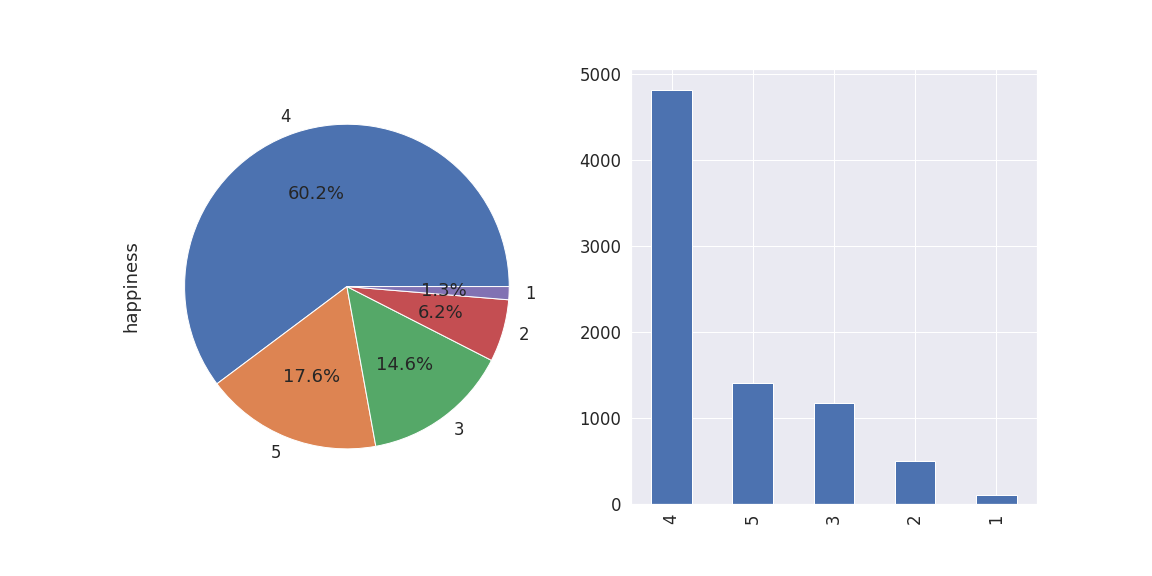
- 大于等于4表示幸福,77.8%的人是幸福的,这说明当今时代,大部分人还是对身处的环境感到幸福的。
-
- 局部幸福情况
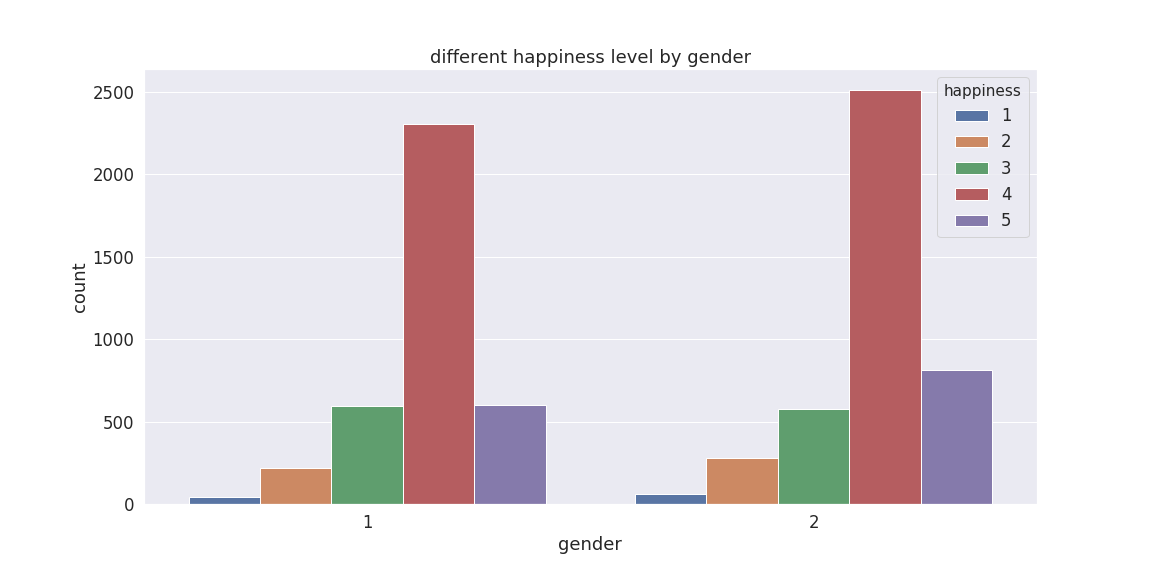
- 男女幸福状况
-
plt.figure(figsize=(16, 8)) sns.countplot(data=df_train, x='gender', hue='happiness') plt.title('different happiness level by gender') plt.savefig('gender_bar.png')- 1
- 2
- 3
- 4
-
plt.figure(figsize=(16, 8)) plt.subplot(1, 2, 1) df_train['happiness'][df_train['gender'] == 1].value_counts().plot(kind='pie', autopct='%1.1f%%') plt.subplot(1, 2, 2) df_train['happiness'][df_train['gender'] == 2].value_counts().plot(kind='pie', autopct='%1.1f%%') plt.title('different happiness level percent by gender') plt.savefig('gender_pie.png')- 1
- 2
- 3
- 4
- 5
- 6
- 7
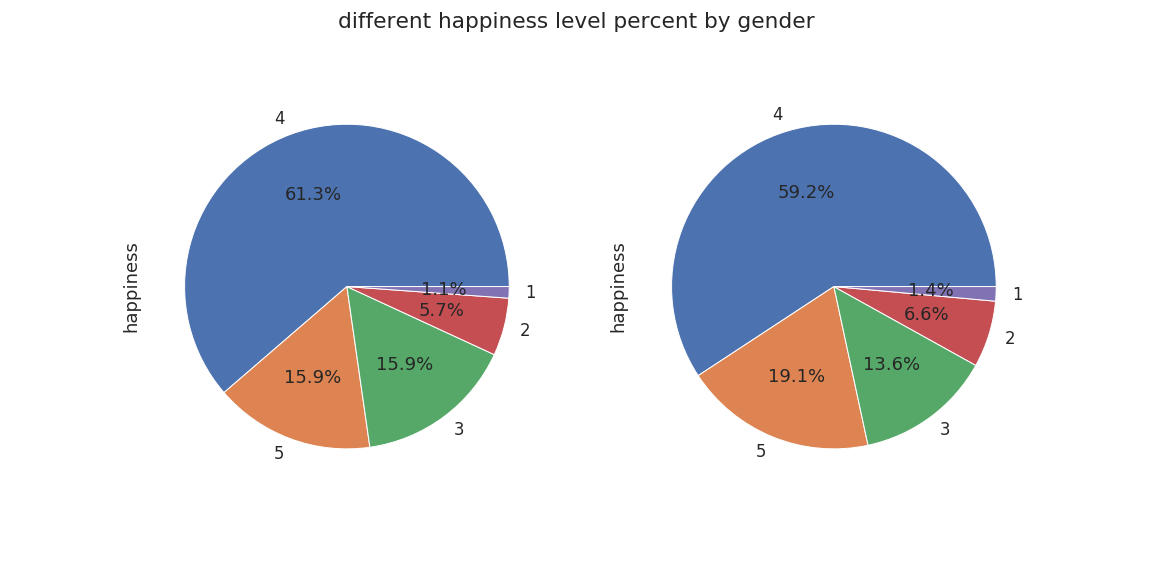
- 整体看来,男女的幸福感差异不大。
-
- 户口幸福状况
- 农村和城市户口分析,类似上面的性别分析,整体看来,城市人员幸福感略高于农村人员。
- 不同年龄段幸福状况
- 类似上面,利用pandas做个筛选即可。
- 不同收入段幸福状况
- 类似上面,利用pandas做个筛选即可。
- 男女幸福状况
- 整体幸福状况
- 数据获取
- 模型构建
- 说明
- 本文建模思路主要使用归一化+PCA(主成分分析)+全连接网络。
- 代码
- 见Github的笔记本文件(ipynb)。
- 提交结果
- 使用简单的全连接神经网络score为0.6148。
- 说明
- 补充说明
- 项目源码上传至我的Github,欢迎Star或者Fork。
- 本文注重EDA而不是建模。
- 如有错误,欢迎指正。
所属网站分类: 技术文章 > 博客
作者:085iitirtu
链接:https://www.pythonheidong.com/blog/article/11237/3ddb32e9c68466cbd07b/
来源:python黑洞网
任何形式的转载都请注明出处,如有侵权 一经发现 必将追究其法律责任
昵称:
评论内容:(最多支持255个字符)
---无人问津也好,技不如人也罢,你都要试着安静下来,去做自己该做的事,而不是让内心的烦躁、焦虑,坏掉你本来就不多的热情和定力