

matplotlib 显示两张图片,折线图 和 scipy
发布于2019-08-07 19:27 阅读(745) 评论(0) 点赞(5) 收藏(5)
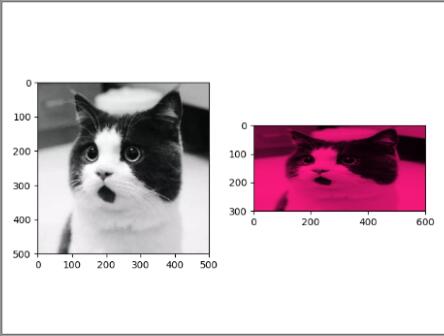
显示两张图片的代码:
import numpy as np
from scipy.misc import imread, imsave, imresize
import matplotlib.pyplot as plt


img = imread('cat.jpg')
print(img.dtype, img.shape)  # uint8 (500, 500, 3)

img_tinted = img * [1, 0.1, 0.5]  # RGB
img_tinted = imresize(img_tinted, (300, 600))
imsave('cat_tinted.jpg', img_tinted)

plt.subplot(1, 2, 1)
plt.imshow(img)

plt.subplot(1, 2, 2)
plt.imshow(img_tinted)

plt.show()
显示结果:
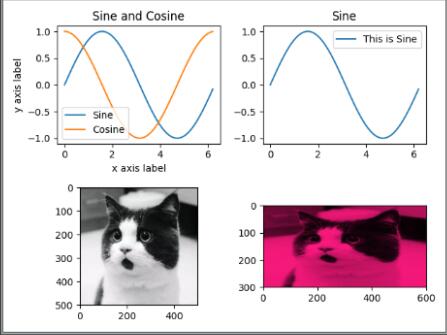
显示四张图片的代码:
x = np.arange(0, 2 * np.pi, 0.1)
y_sin = np.sin(x)
y_cos = np.cos(x)

plt.subplot(2, 2, 1)
plt.plot(x, y_sin)
plt.plot(x, y_cos)
plt.xlabel('x axis label')
plt.ylabel('y axis label')
plt.title('Sine and Cosine')
plt.legend(['Sine', 'Cosine'])

plt.subplot(2, 2, 2)
plt.plot(x, y_sin)
plt.title('Sine')
plt.legend(['This is Sine'])

# img = imread('cat.jpg')
plt.subplot(2, 2, 3)
plt.imshow(img)

plt.subplot(2, 2, 4)
plt.imshow(np.uint8(img_tinted))

plt.show()
显示结果:
计算任意两点间的欧氏距离
from scipy.spatial.distance import pdist, squareform
x= np.array([[0, 1], [1, 0], [2, 0]])
d= squareform(pdist(x, 'euclidean'))
print(d)
[[0. 1.41421356 2.23606798]
[1.41421356 0. 1. ]
[2.23606798 1. 0. ]]
所属网站分类: 技术文章 > 博客
作者:fhue34873
链接:https://www.pythonheidong.com/blog/article/12415/70a93fc2b7364d92bb34/
来源:python黑洞网
任何形式的转载都请注明出处,如有侵权 一经发现 必将追究其法律责任
昵称:
评论内容:(最多支持255个字符)
---无人问津也好,技不如人也罢,你都要试着安静下来,去做自己该做的事,而不是让内心的烦躁、焦虑,坏掉你本来就不多的热情和定力