How to adjust the size of one subplot independently of other subplots in a matplotlib figure?
发布于2024-12-08 09:45 阅读(100) 评论(0) 点赞(5) 收藏(0)
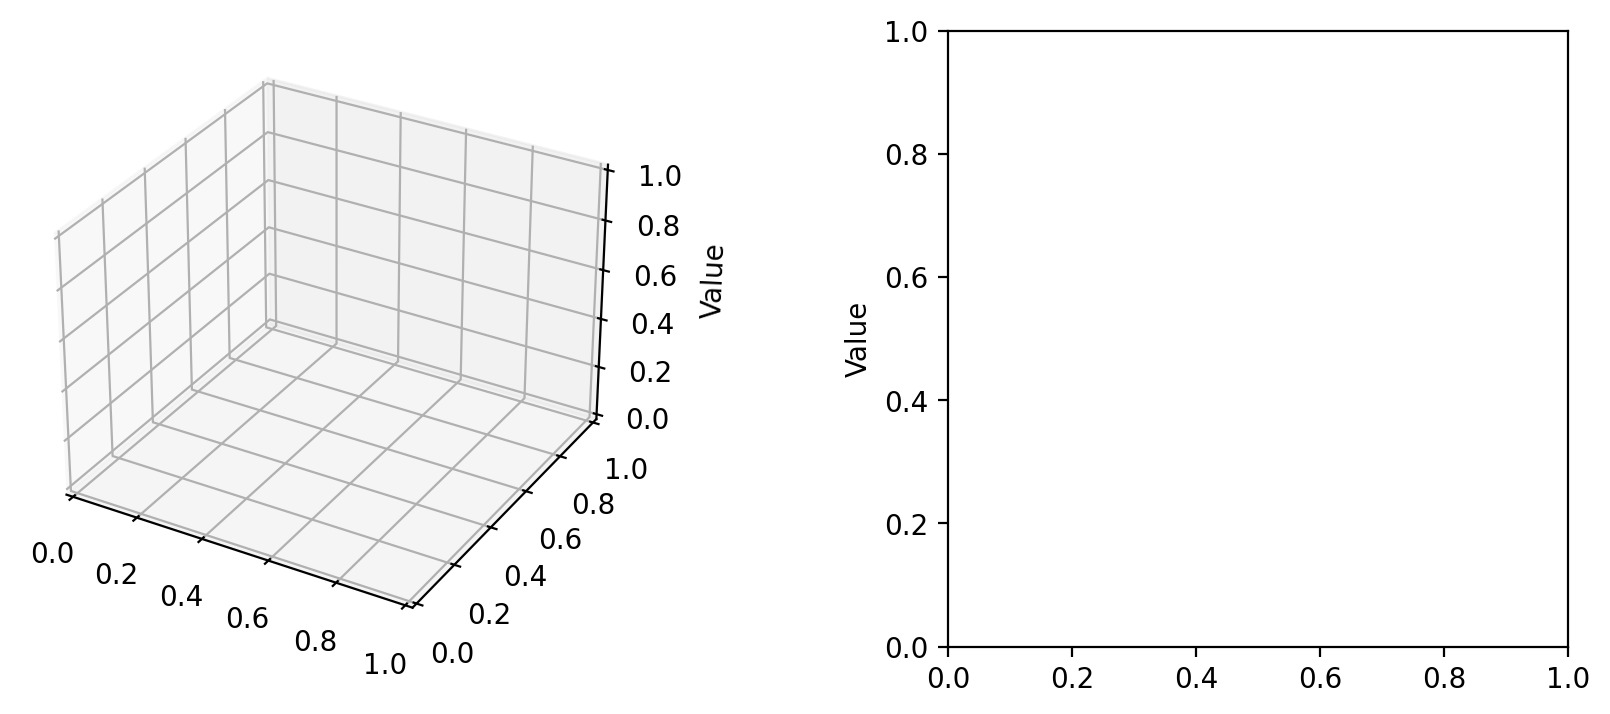
I want to have horizontally aligned 3D and 2D plots, where the y-axis of the 2D plot is the same height as the z-axis of the 3D plot. The following code produces a default output:
import matplotlib.pyplot as plt
fig = plt.figure()
fig.set_size_inches(10, 4)
fig.subplots_adjust(wspace=0.5)

# 3D surface plot
ax1 = fig.add_subplot(121, projection="3d")
ax1.set(zlabel="Value")

# 2D line plot
ax2 = fig.add_subplot(122)
ax2.set(ylabel="Value")

plt.show()
I want to shrink down the right hand side 2D subplot so that the y-axis ("Value") is a similar height to (or preferably the same height as) the z-axis ("Value") on the 3D plot (ideally I want them to line up).
I haven't been able to find a way to change subplot sizes independently like this in matplotlib (setting relative ratios and gridspec don't seem able to achieve this).
Any help would be much appreciated.
解决方案
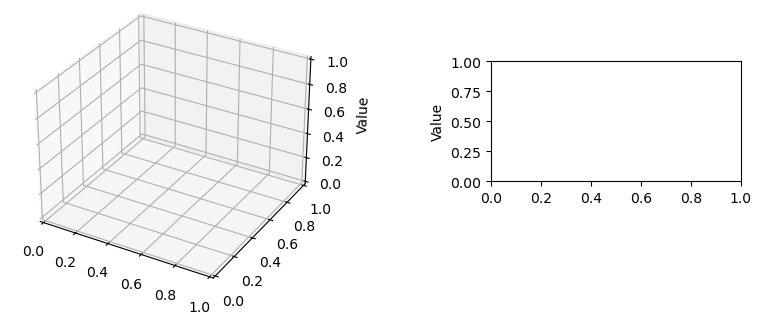
You can use set_position() to change the dimensions of one of the subplot:
plt.figure(1).axes[1].set_position([0.6,0.4,0.25,0.3]) # left, bottom, width, height
所属网站分类: 技术文章 > 问答
作者:黑洞官方问答小能手
链接:https://www.pythonheidong.com/blog/article/2046413/cb7b239db0302e22e9c3/
来源:python黑洞网
任何形式的转载都请注明出处,如有侵权 一经发现 必将追究其法律责任
昵称:
评论内容:(最多支持255个字符)
---无人问津也好,技不如人也罢,你都要试着安静下来,去做自己该做的事,而不是让内心的烦躁、焦虑,坏掉你本来就不多的热情和定力

