本站消息


【Python数据可视化】Matplotlib学习笔记之pyplot(2)
发布于2020-02-25 09:52 阅读(895) 评论(0) 点赞(17) 收藏(0)
【Python数据可视化】Matplotlib学习笔记之pyplot(2)
简介:Matplotlib 是一个Python的 2D绘图库,它以各种硬拷贝格式和跨平台的交互式环境生成出版质量级别的图形 。通过 Matplotlib,开发者可以仅需要几行代码,便可以生成绘图,直方图,功率谱,条形图,错误图,散点图等。
编程环境:Python 3.8
pycharm 2017
需要安装的库:numpy,matplotlib
接上篇【Python数据可视化】Matplotlib学习笔记之pyplot(1) <<<点此阅读
- '''8.面向对象的方法绘图'''
- import numpy as np
- import matplotlib.pyplot as plt
- from pylab import *
- '''
- 1.pyplot 经典高层封装
- 简单易用,交互使用方便,可以根据命令实时作图
- 但底层定制能力不强
- '''
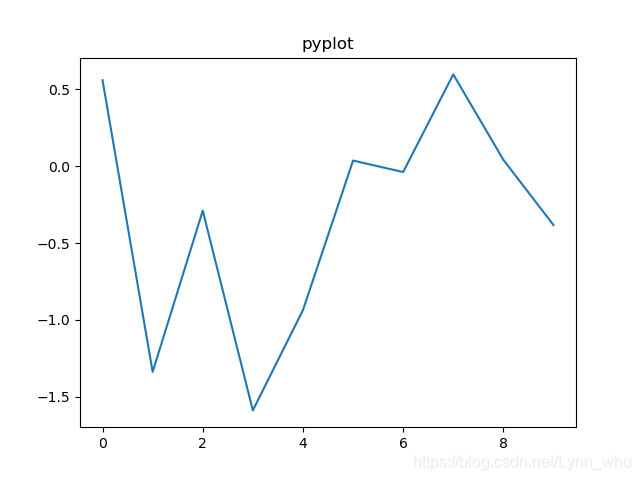
- m=np.arange(0,10,1)
- n=np.random.randn(len(m))
- plt.plot(m,n)
- plt.title('pyplot')
- plt.show()
- '''
- 2.pylab 将matplotlib和numpy合并的模块,模拟MATLAB编程环境
- 完全封装,环境最接近MATLAB,不推荐使用
- '''
- x=arange(0,10,1)
- y=randn(len(x))
-
- plot(x,y)
- title('pylab')
- show()
-
- '''
- 3.面向对象的方式,matplotlib的精髓,更基础和底层的方式
- (object-oriented),接近matplotlib基础和底层的方式。
- 难度稍大,但定制能力强。
- 总结:实战中推荐,总和使用OO和pyplot的方式,显示导入numpy
- 常用模块导入代码:
- import numpy as np
- import matplotlib.pyplot as plt
- '''
- a=np.arange(0,10,1)
- b=np.random.randn(len(a))
-
- fig=plt.figure()
- ax=fig.add_subplot(111)
- l,=plt.plot(a,b)
- t=ax.set_title("object-oriented")
-
- plt.show()
- '''9.使用subplot绘制子图'''
- import numpy as np
- import matplotlib.pyplot as plt
-
- '''
- matplotlib对象简介
- FigureCanvas--画布
- Figure--------图
- Axes----------坐标轴
- 1. fig=plt.figure()
- Figure 实例
- 可以添加Axes实例
-
- 2.ax=fig.add_subplot(111) ----添加子图
- 返回Axes实例
- 参数一:子图总行数
- 参数二:子图总列数
- 参数三:子图位置
- 在Figure上添加Axes的常用方法
- '''
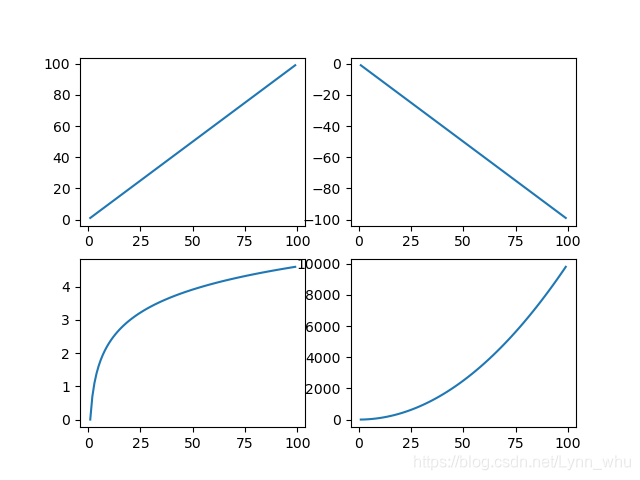
- x=np.arange(1,100)
-
- fig=plt.figure()
- ax1=fig.add_subplot(221)
- ax2=fig.add_subplot(222)
- ax3=fig.add_subplot(223)
- ax4=fig.add_subplot(224)
-
- ax1.plot(x,x)
- ax2.plot(x,x**2/100)
- ax3.plot(x,-x)
- ax4.plot(x,np.log(x))
-
- plt.show()
-
- #pyplot画子图
- x=np.arange(1,100)
-
- plt.subplot(221)
- plt.plot(x,x)
-
- plt.subplot(222)
- plt.plot(x,-x)
-
- plt.subplot(223)
- plt.plot(x,np.log(x))
-
- plt.subplot(224)
- plt.plot(x,x**2)
-
- plt.show()

- '''10.创建多图'''
- import numpy as np
- import matplotlib.pyplot as plt
-
- '''创建多个Figure'''
- fig1=plt.figure()
- ax1=fig1.add_subplot(111)
- ax1.plot([1,2,3],[3,2,1])
-
- fig2=plt.figure()
- ax2=fig2.add_subplot(111)
- ax2.plot([1,2,3],[1,2,3])
-
- plt.show()
-
-
- '''11.添加网格'''
- import numpy as np
- import matplotlib.pyplot as plt
-
- '''plt封装方式'''
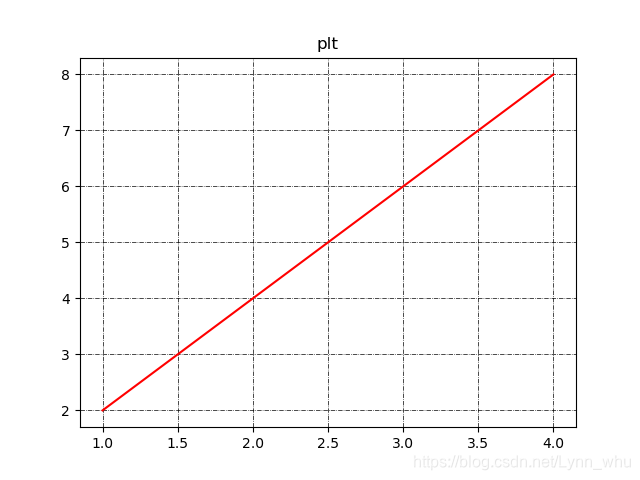
- y=np.arange(1,5)
- plt.plot(y,y*2,'r')
- plt.grid(True)#简单打开网格
- plt.title('plt')
-
- plt.grid(color='k',linewidth='0.5',linestyle='-.')#设置网格
- plt.show()
-
- '''面向对象'''
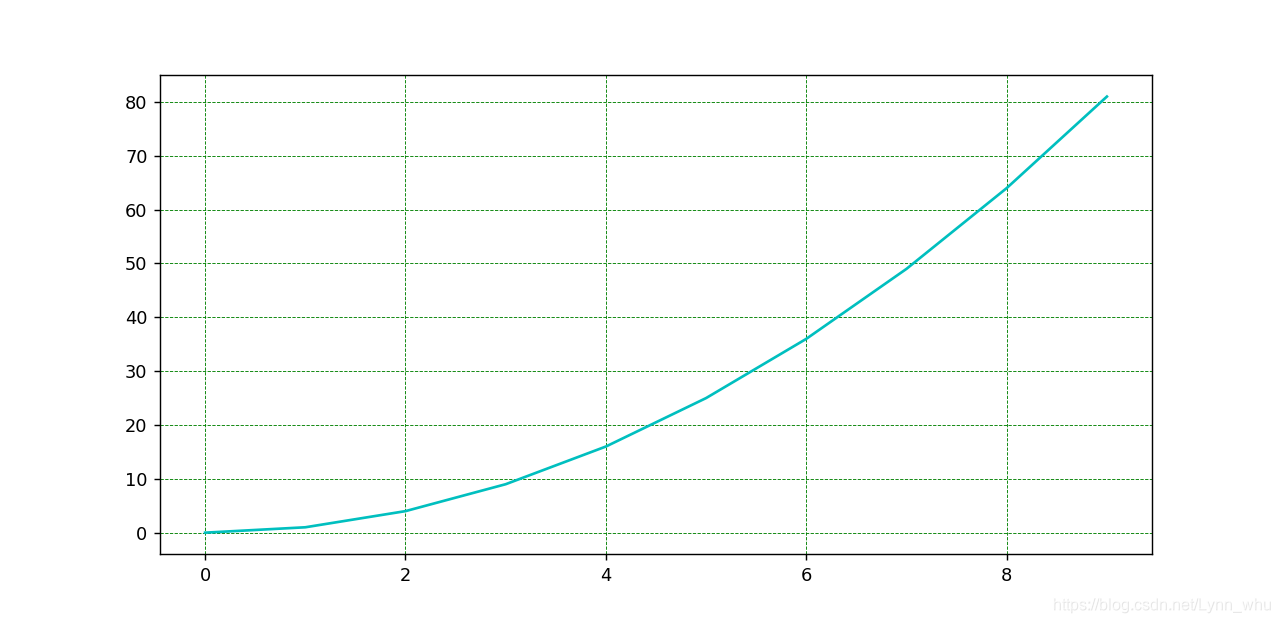
- x=np.arange(0,10,1)
-
- fig=plt.figure(figsize=(16,8),dpi=128) #设置图幅大小及分辨率
- ax=fig.add_subplot(111)
- plt.plot(x,x**2,'c')
- ax.grid(color='g',linewidth='0.5',linestyle='--')
-
- plt.show()
-
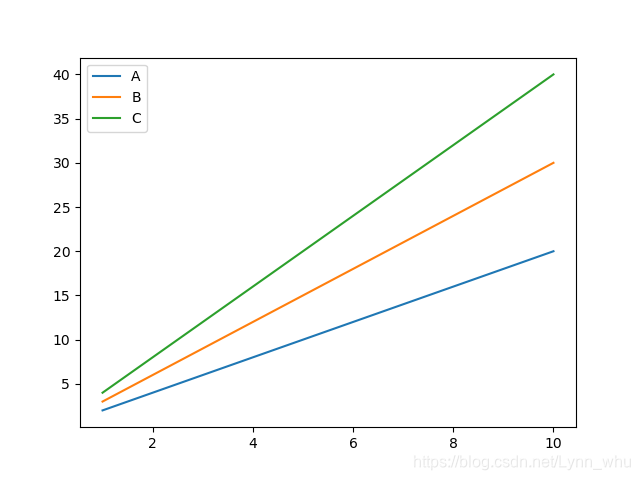
- '''12.添加图例legend'''
- import numpy as np
- import matplotlib.pyplot as plt
-
- '''plt方式'''
- x=np.arange(1,11,1)
-
- plt.plot(x,x*2,label='Normal')#label--图例名称
- plt.plot(x,x*3,label='Fast')
- plt.plot(x,x*4,label='Faster')
- plt.legend(loc=0,ncol=2)
- '''显示图例 loc 位置 0 best
- 1 upper right
- 2 upper left
- 3 lower left
- 4 lower right
- 5 right
- 6 center left
- 7 center right
- 8 lower center
- 9 upper center
- 10 center
- ncol 图例列数
- '''
- plt.legend(['A','B','C']) #也可将图例标签设置在legend里
-
- plt.show()
-
- '''面向对象'''
- fig=plt.figure()
- ax=fig.add_subplot(111)
- l,=plt.plot(x,x)
-
- '''1.使用ax绘图例'''
- #ax.legend(['ax legend'])
- '''2.1使用set_label绘制图例
- 2.2 set后显示图例'''
- #l.set_label('label via method')
- #ax.legend()
- '''3.直接在plot里绘制图例'''
- l,=plt.plot(x,x**2,label='label via plot')
- ax.legend()
-
- plt.show()
 接下篇【Python数据可视化】Matplotlib学习笔记之pyplot(3) <<<点此阅读

所属网站分类: 技术文章 > 博客
作者:进击的巨人
链接:https://www.pythonheidong.com/blog/article/233095/4679e48d3df06e71780b/
来源:python黑洞网
任何形式的转载都请注明出处,如有侵权 一经发现 必将追究其法律责任
17
0
收藏该文
昵称:
评论内容:(最多支持255个字符)
---无人问津也好,技不如人也罢,你都要试着安静下来,去做自己该做的事,而不是让内心的烦躁、焦虑,坏掉你本来就不多的热情和定力
站长公众号(new)
更多>
pdf(new)
更多>
问答(new)
更多>
游戏(new)
更多>