

使用SVR(支持向量回归机)的RBF(高斯核函数)拟合预测股票
发布于2019-08-22 17:00 阅读(3877) 评论(0) 点赞(28) 收藏(4)
目标:
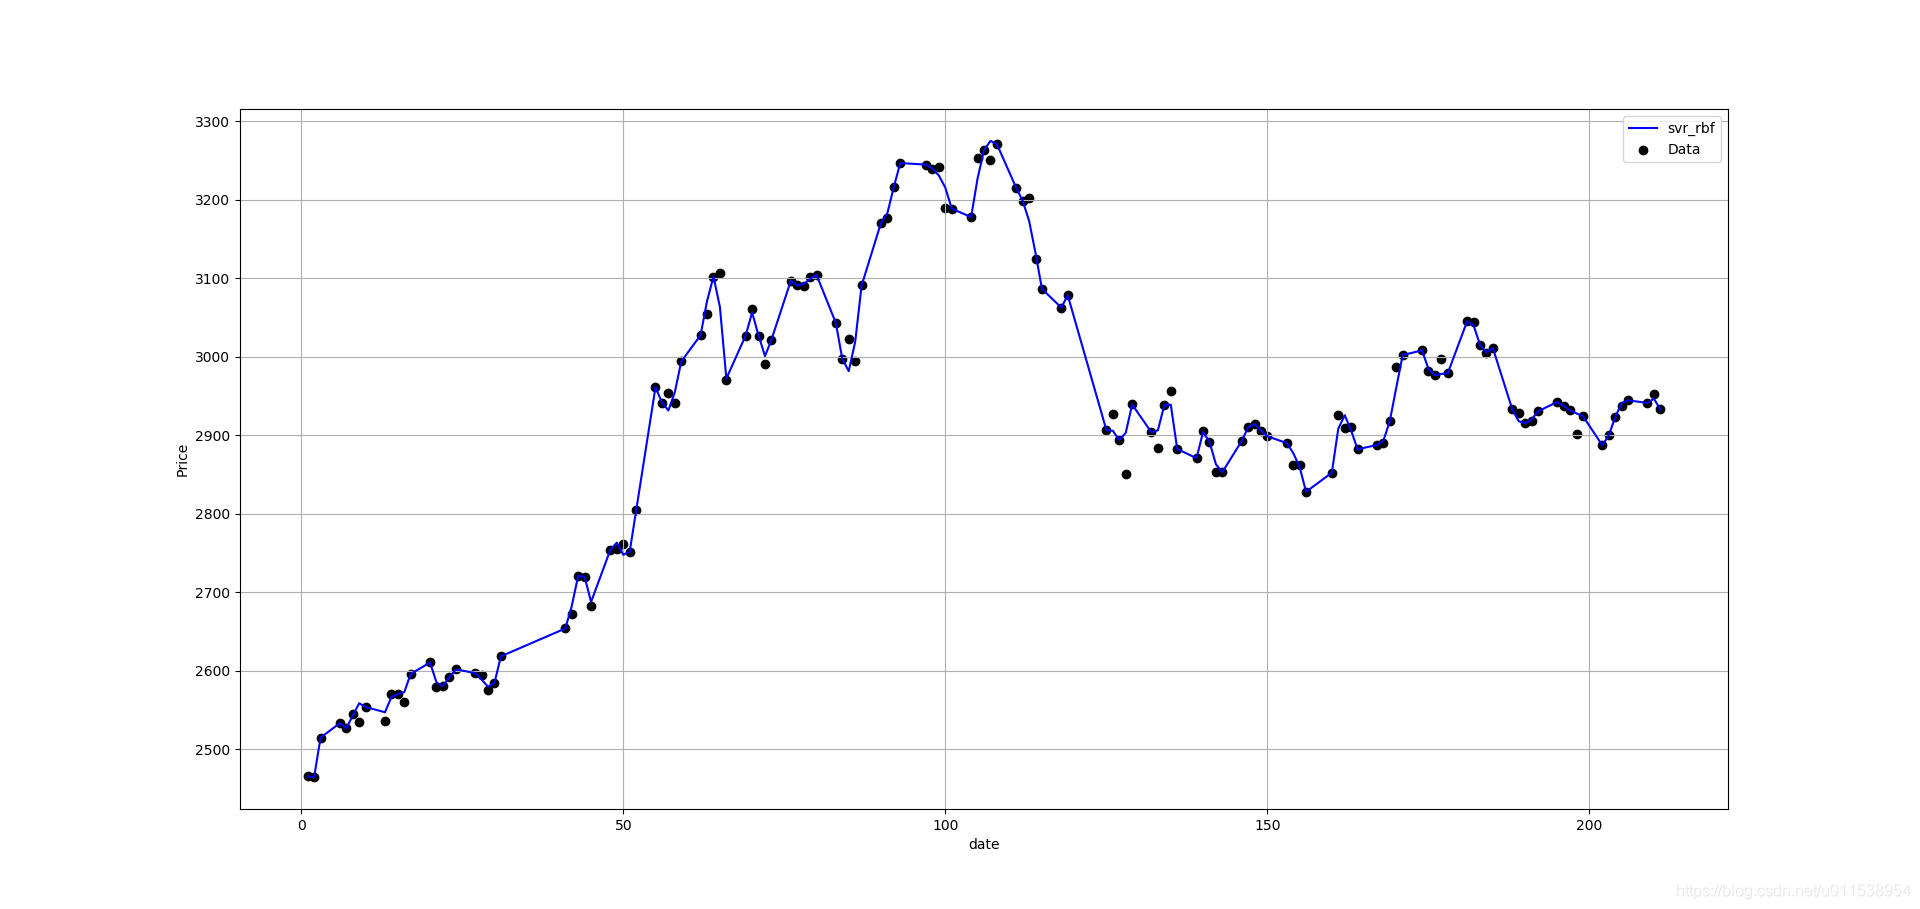
根据2019-01-01 至 2019-07-30 , 沪市指数的收盘价, 使用SVR, 回归预测 2019-07-31( 或者2019-08-01)的收盘价
拟合结果:
[LibSVM]..........................*...........*
optimization finished, #iter = 10450
obj = -1700429.608042, rho = -2906.668575
nSV = 141, nBSV = 52
SVR(C=1000.0, cache_size=1000, coef0=0.0, degree=3, epsilon=0.1, gamma=0.1,
kernel='rbf', max_iter=-1, shrinking=True, tol=0.001, verbose=True)
2933.009977517439
拟合效果
实际K线图

代码
- import os
- import numpy as np
- import pandas as pd
- from scipy import stats
- import matplotlib.pyplot as plt
- from datetime import datetime as dt
- from sklearn import preprocessing
- from sklearn.svm import SVC, SVR
- import plotly.offline as of
- import plotly.graph_objs as go
- import tushare as ts
-
-
- # pip install ciso8601
- # pip install stockai
- def get_stock_data(stock_num, start):
- """
- 下载数据
- 股票数据的特征
- date:日期
- open:开盘价
- high:最高价
- close:收盘价
- low:最低价
- volume:成交量
- price_change:价格变动
- p_change:涨跌幅
- ma5:5日均价
- ma10:10日均价
- ma20:20日均价
- v_ma5:5日均量
- v_ma10:10日均量
- v_ma20:20日均量
- :param stock_num:
- :return:df
- """
- df = ts.get_hist_data(stock_num, start=start, ktype='D')
- return df
-
-
- def draw_kchart(df, filename):
- """
- 画k线图
- """
- Min_date = df.index.min()
- Max_date = df.index.max()
- print("First date is", Min_date)
- print("Last date is", Max_date)
- interval_date = dt.strptime(Max_date, "%Y-%m-%d") - dt.strptime(Min_date, "%Y-%m-%d")
- print(interval_date)
- trace = go.Ohlc(x=df.index, open=df['open'], high=df['high'], low=df['low'], close=df['close'])
- data = [trace]
- of.plot(data, filename=filename)
-
-
- def stock_etl(df):
- df.dropna(axis=0, inplace=True)
- # print(df.isna().sum())
- df.sort_values(by=['date'], inplace=True, ascending=True)
- return df
-
-
- def get_data(df):
- data = df.copy()
- # 年,月,天
- # data['date'] = data.index.str.split('-').str[2]
- # data['date'] = data.index.str.replace('-','')
- # print(data.index.tolist())
- data['date'] = [(dt.strptime(x, '%Y-%m-%d') - dt.strptime('2019-01-01', '%Y-%m-%d')).days for x in data.index.tolist()]
- data['date'] = pd.to_numeric(data['date'])
- return [data['date'].tolist(), data['close'].tolist()]
-
-
- def predict_prices(dates, prices, x):
- dates = np.reshape(dates, (len(dates), 1))
- x = np.reshape(x, (len(x), 1))
-
- svr_lin = SVR(kernel='linear', C=1e3,gamma=0.1, verbose=True, cache_size=1000)
- svr_poly = SVR(kernel='poly', C=1e3, degree=2, gamma=0.1, verbose=True, cache_size=1000)
- svr_rbf = SVR(kernel='rbf', C=1e3, gamma=0.1, verbose=True, cache_size=1000)
-
- plt.scatter(dates, prices, c='k', label='Data')
- # 训练
- # svr_lin.fit(dates, prices)
- # print(svr_lin)
- # print(svr_lin.predict(x)[0])
- # plt.plot(dates, svr_lin.predict(dates), c='g', label='svr_lin')
-
- # svr_poly.fit(dates, prices)
- # print(svr_poly)
- # print(svr_poly.predict(x)[0])
- # plt.plot(dates, svr_lin.predict(dates), c='g', label='svr_lin')
-
- svr_rbf.fit(dates, prices)
- print(svr_rbf)
- print(svr_rbf.predict(x)[0])
- plt.plot(dates, svr_rbf.predict(dates), c='b', label='svr_rbf')
-
- plt.xlabel('date')
- plt.ylabel('Price')
- plt.grid(True)
- plt.legend()
- plt.show()
- # return svr_lin.predict(x)[0], svr_poly.predict(x)[0], svr_rbf.predict(x)[0]
-
-
- if __name__ == "__main__":
- """
- 预测股价和时间之间的关系
- """
- # sh 获取上证指数k线数据
- # sz 获取深圳成指k线数据
- # cyb 获取创业板指数k线数据
- df = get_stock_data('sh', '2019-01-01')
- # + 张家港行
- # df = get_stock_data('002839', '2019-01-01')
- df = stock_etl(df)
-
- curPath = os.path.abspath(os.path.dirname(__file__))
- draw_kchart(df, curPath + '/simple_ohlc.html')
-
- dates, prices = get_data(df)
- print(dates)
- print(prices)
- # print(predict_prices(dates, prices, [31]))
- # print(predict_prices(dates, prices, ['20190731']))
- a = dt.strptime('2019-07-31', '%Y-%m-%d')
- b = dt.strptime('2019-01-01', '%Y-%m-%d')
- c = (a - b).days
- predict_prices(dates, prices, [c])
遇到问题: 使用多项式核函数, 60%的CPU跑了4个小时没有拟合出来.
使用线性核函数, 跑了40分钟才拟合出来结果.
使用高斯核函数,1分钟就拟合出结果了
源码:
https://github.com/clark99/learnMachinelearning/blob/master/sklearn/demo/svm/
所属网站分类: 技术文章 > 博客
作者:085iitirtu
链接:https://www.pythonheidong.com/blog/article/53122/fd4b771a0d783960b142/
来源:python黑洞网
任何形式的转载都请注明出处,如有侵权 一经发现 必将追究其法律责任
昵称:
评论内容:(最多支持255个字符)
---无人问津也好,技不如人也罢,你都要试着安静下来,去做自己该做的事,而不是让内心的烦躁、焦虑,坏掉你本来就不多的热情和定力